


PICK UP!
NEWS最新情報
- すべて
- ニュース
- 研究
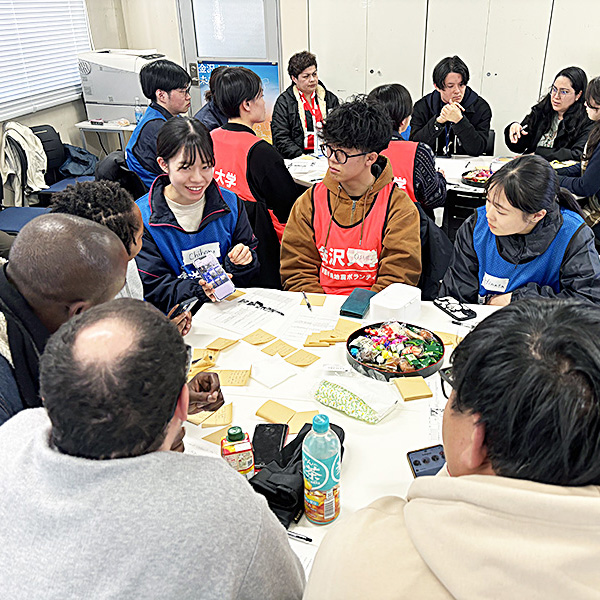
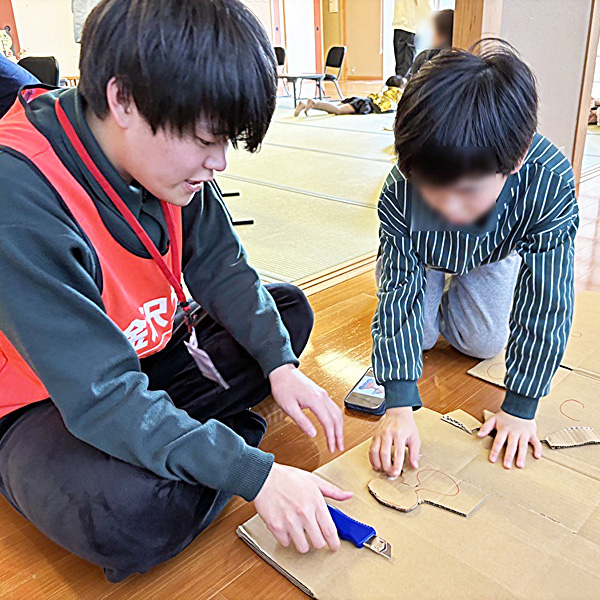
- 能登復興
-
 研究
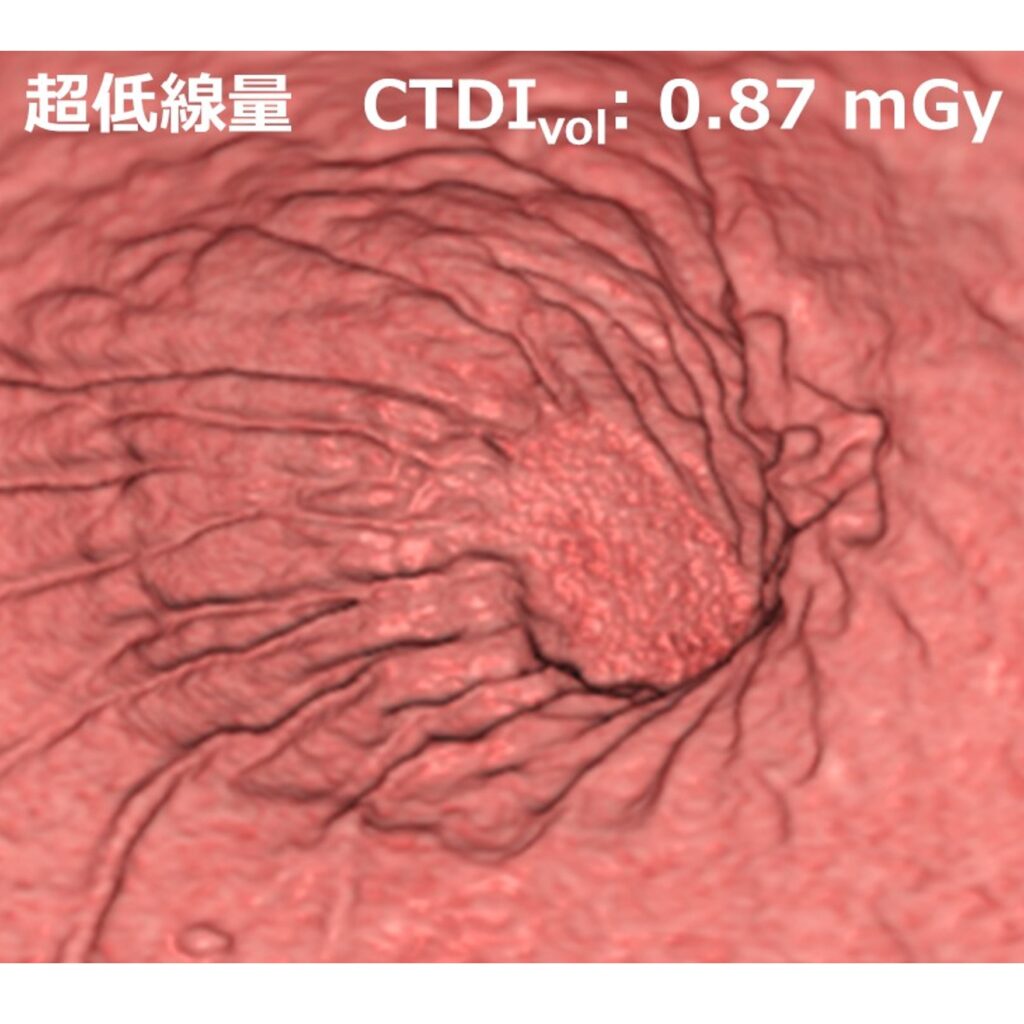
CT で「胃カメラ」を再現
研究
CT で「胃カメラ」を再現
次世代の低線量・胃がん検診へ -
 ニュース
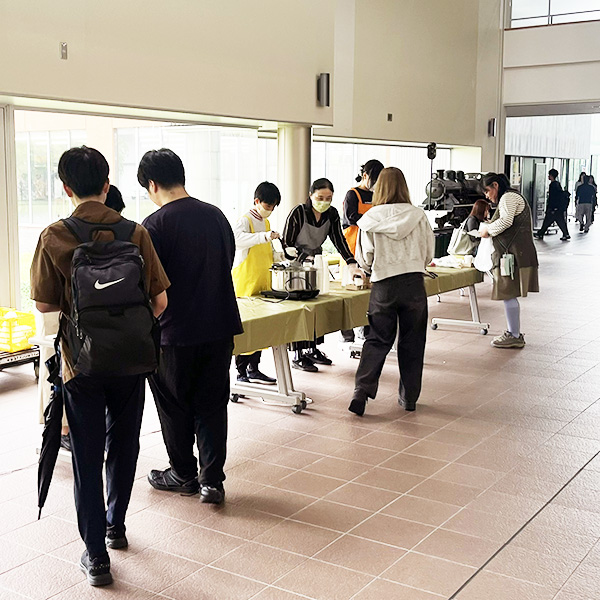
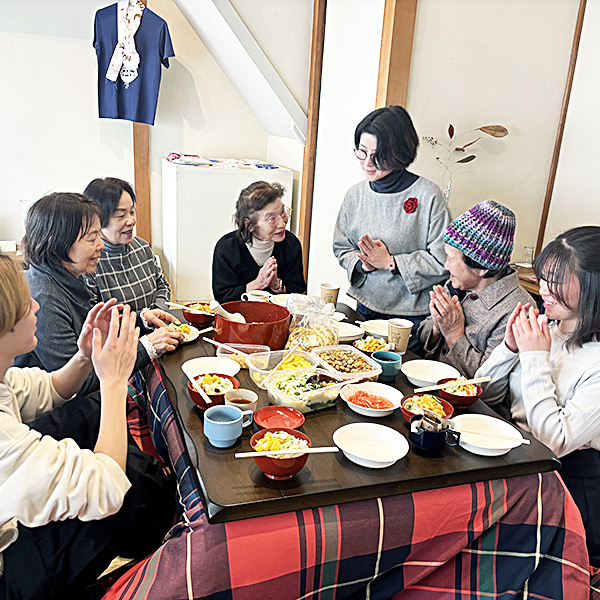
学生の健康を考えた「野菜たっぷり簡単朝食スープ試食会」を開催
ニュース
学生の健康を考えた「野菜たっぷり簡単朝食スープ試食会」を開催
-
 ニュース
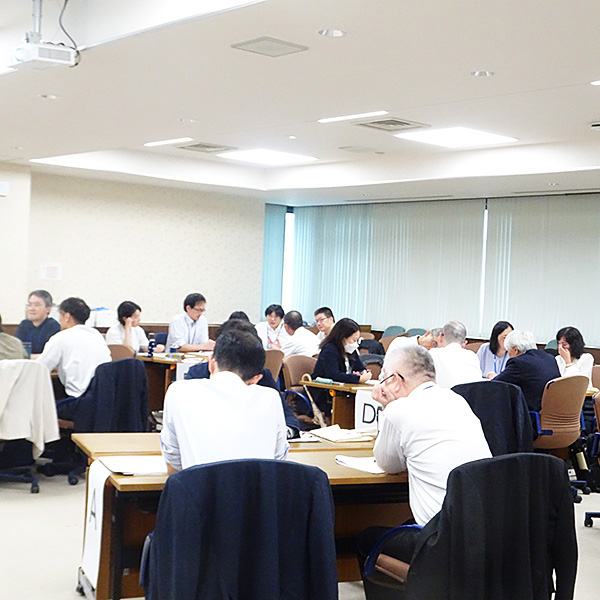
管理職の役割を学ぶ国立大学法人等マネジメント研修を実施
ニュース
管理職の役割を学ぶ国立大学法人等マネジメント研修を実施
-
 ニュース
令和8年度学類入学者の父母等との懇談会を開催
ニュース
令和8年度学類入学者の父母等との懇談会を開催
-
 研究
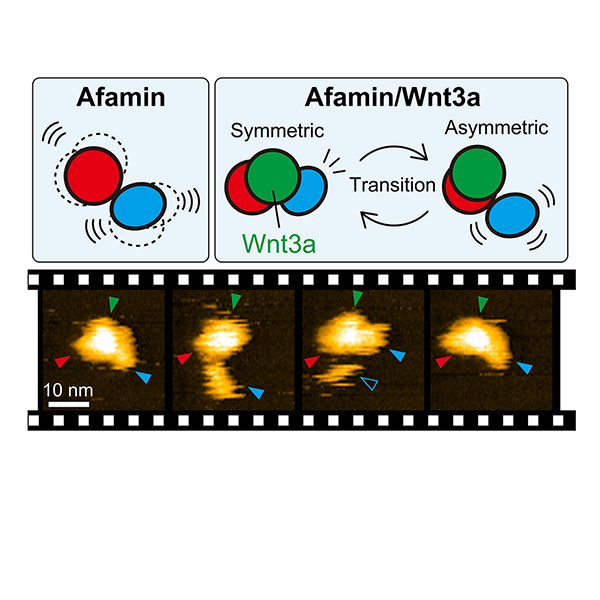
生命のシグナルを運ぶ仕組み、その動きを捉える
研究
生命のシグナルを運ぶ仕組み、その動きを捉える
-
 研究
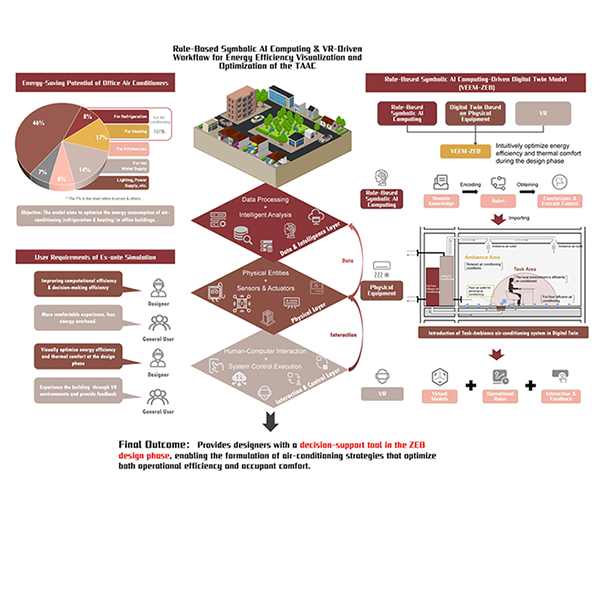
AIとVRで空調の効率と快適さを可視化
研究
AIとVRで空調の効率と快適さを可視化
-
ニュース
学生の健康を考えた「野菜たっぷり簡単朝食スープ試食会」を開催
-
ニュース
管理職の役割を学ぶ国立大学法人等マネジメント研修を実施
-
ニュース
令和8年度学類入学者の父母等との懇談会を開催
-
 ニュース
文科省「卓越大学院プログラム」
ニュース
文科省「卓越大学院プログラム」
最高【S評価】を獲得 -
 ニュース
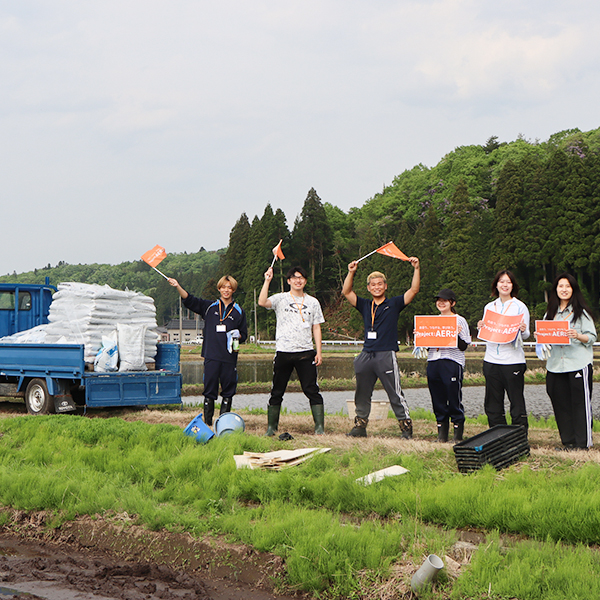
学生が大学オリジナル日本酒に使用する有機酒米の田植えを体験
ニュース
学生が大学オリジナル日本酒に使用する有機酒米の田植えを体験
-
 ニュース
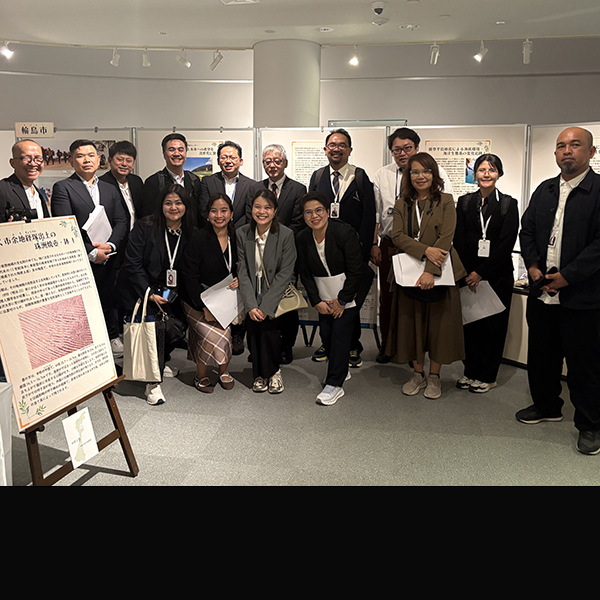
タイ文化省訪問団が来学し
ニュース
タイ文化省訪問団が来学し
文化財保存などについて意見交換
その他のニュース
EVENTイベント情報
SPECIAL CONTENTS地球、環境、社会のための金沢大学の活動

INFORMATION学内情報
地域と世界に開かれた
教育重視の研究大学。
金沢大学の源流は、1862(文久2)年に創設された加賀藩彦三種痘所。諸先輩が築き上げてきた歴史を礎に、地域と世界の2つの視点を互いに往還させながら、未来の課題を探求し克服する知恵「未来知」により社会貢献を果たすことをビジョンとしています。