


Abstract:
A Japan-based research team led by Kanazawa University have found that bright spot areas have generally lower fluorescence in brain tumors than in normal tissues in images captured by irradiation with a 405 nm wavelength laser and 544.5–619.5 nm band-pass filter. This may facilitate discrimination of glioblastoma with or without 5-aminolevulinic acid fluorescence and could be applicable to other tumors.
[Background]
Photodynamic diagnosis using 5-aminolevulinic acid (5-ALA) is now widely used for neurosurgical resection of brain tumors. Distinguishing a tumor from healthy tissue is based on greater 5-ALA-derived protoporphyrin IX accumulation in glioma cells than in non-cancerous cells, resulting in much greater red fluorescence (peak at 635 nm) when excited at 405 nm. However, it is still difficult to precisely distinguish the tumor margin and infiltrating regions from non-tumor tissue because the fluorescent boundary is usually vague. In our previous study, we noticed that bright spots in confocal microscopy images may be able to distinguish tumors from normal tissue.
[Methods]
Brain tumor tissues resected from 5-ALA-treated patients was sectioned to evaluate bright spots captured by a 544.5–619.5 nm wavelength band-pass filter that eliminated the fluorescence induced by 5-ALA under a confocal microscope. Boarder regions and adjacent normal tissues were observed. Pathological inspection was performed to confirm the locations of tumors, infiltrating tumor cells, and normal tissue regions by hematoxylin and eosin (H&E) staining of serial sections of the same samples. Bright spot areas were measured in the same region used for pathological inspection. This method was applied to brain tumors with and without red fluorescence as well as glioblastoma (GBM) and non-GBM brain tumors.
[Results]
The bright spot area was substantially smaller in the GBM tumor than in normal brain tissues. It was also smaller in infiltrating tumors than in normal tissue at the margin. The same bright spot pattern was observed in tumors tissues without red fluorescence and in non-GBM tumors. Bright spot fluorescence has been suggested to be derived from lipofuscin based on emission spectra (mainly within 544.5−619.5 nm) and an optimal excitation wavelength (about 405 nm).
[Significance and future prospects]
Bright spot analysis is useful to facilitate discrimination of an infiltrating tumor from bordering normal tissue in photodynamic diagnosis using 5-ALA. This method is also potentially useful for tumors without 5-ALA-derived red fluorescence and non-GBM tumors. The mechanism of bright spot fluorescence reduction in tumors and its application for precise discrimination of brain tumors should be investigated further.
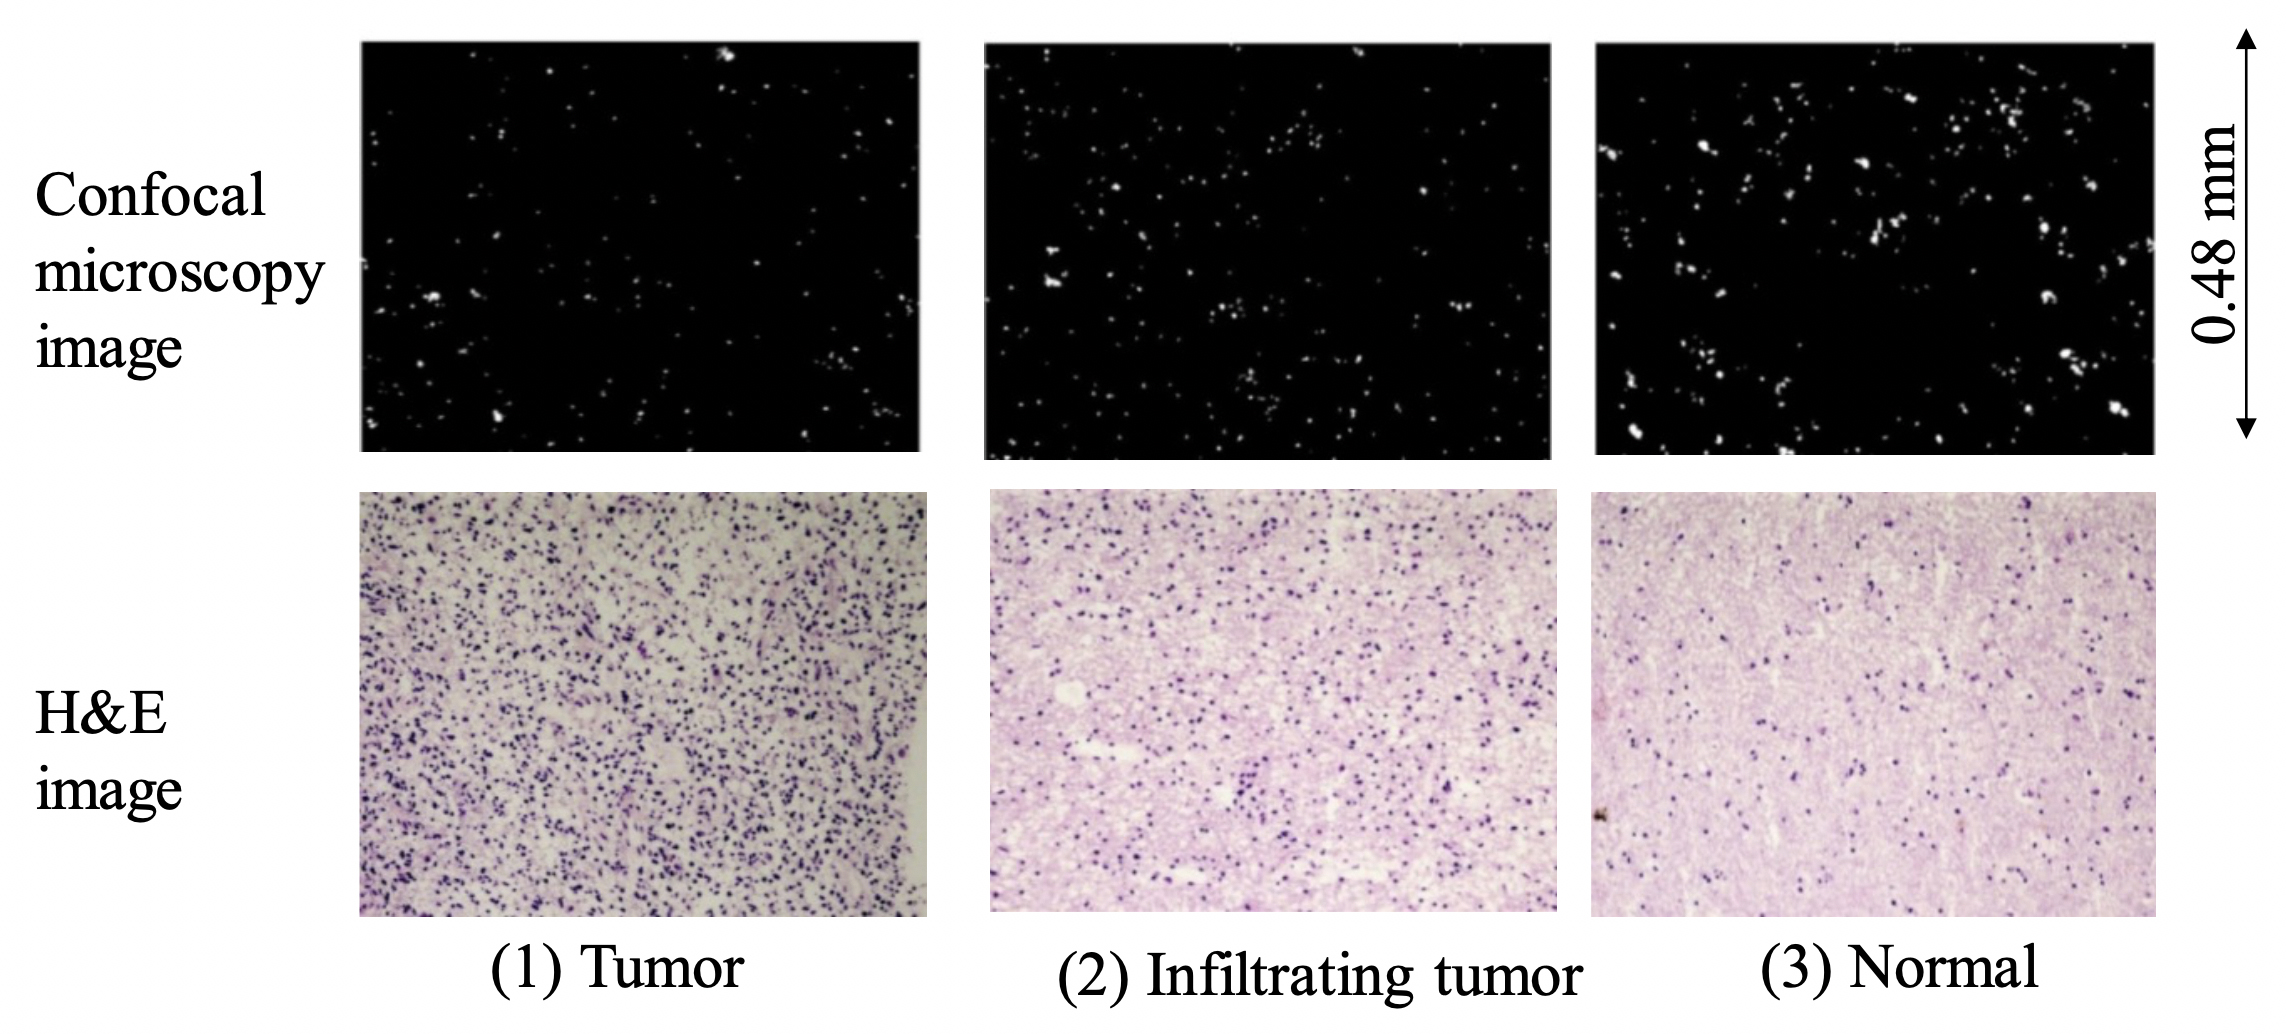
Figure 1.
Example of reduction of the bright spot area in a GBM tumor compared with that in normal tissue. An example of the comparison between H&E-stained images and bright spot confocal images of a GBM specimen irradiated by a 405 nm wavelength laser and imaged using a band-pass filter with a 618.5–675.5 nm wavelength is shown. All three images are of the same boundary specimen. There were many more bright spots in the normal tissue region, and individual bright spot sizes were larger.
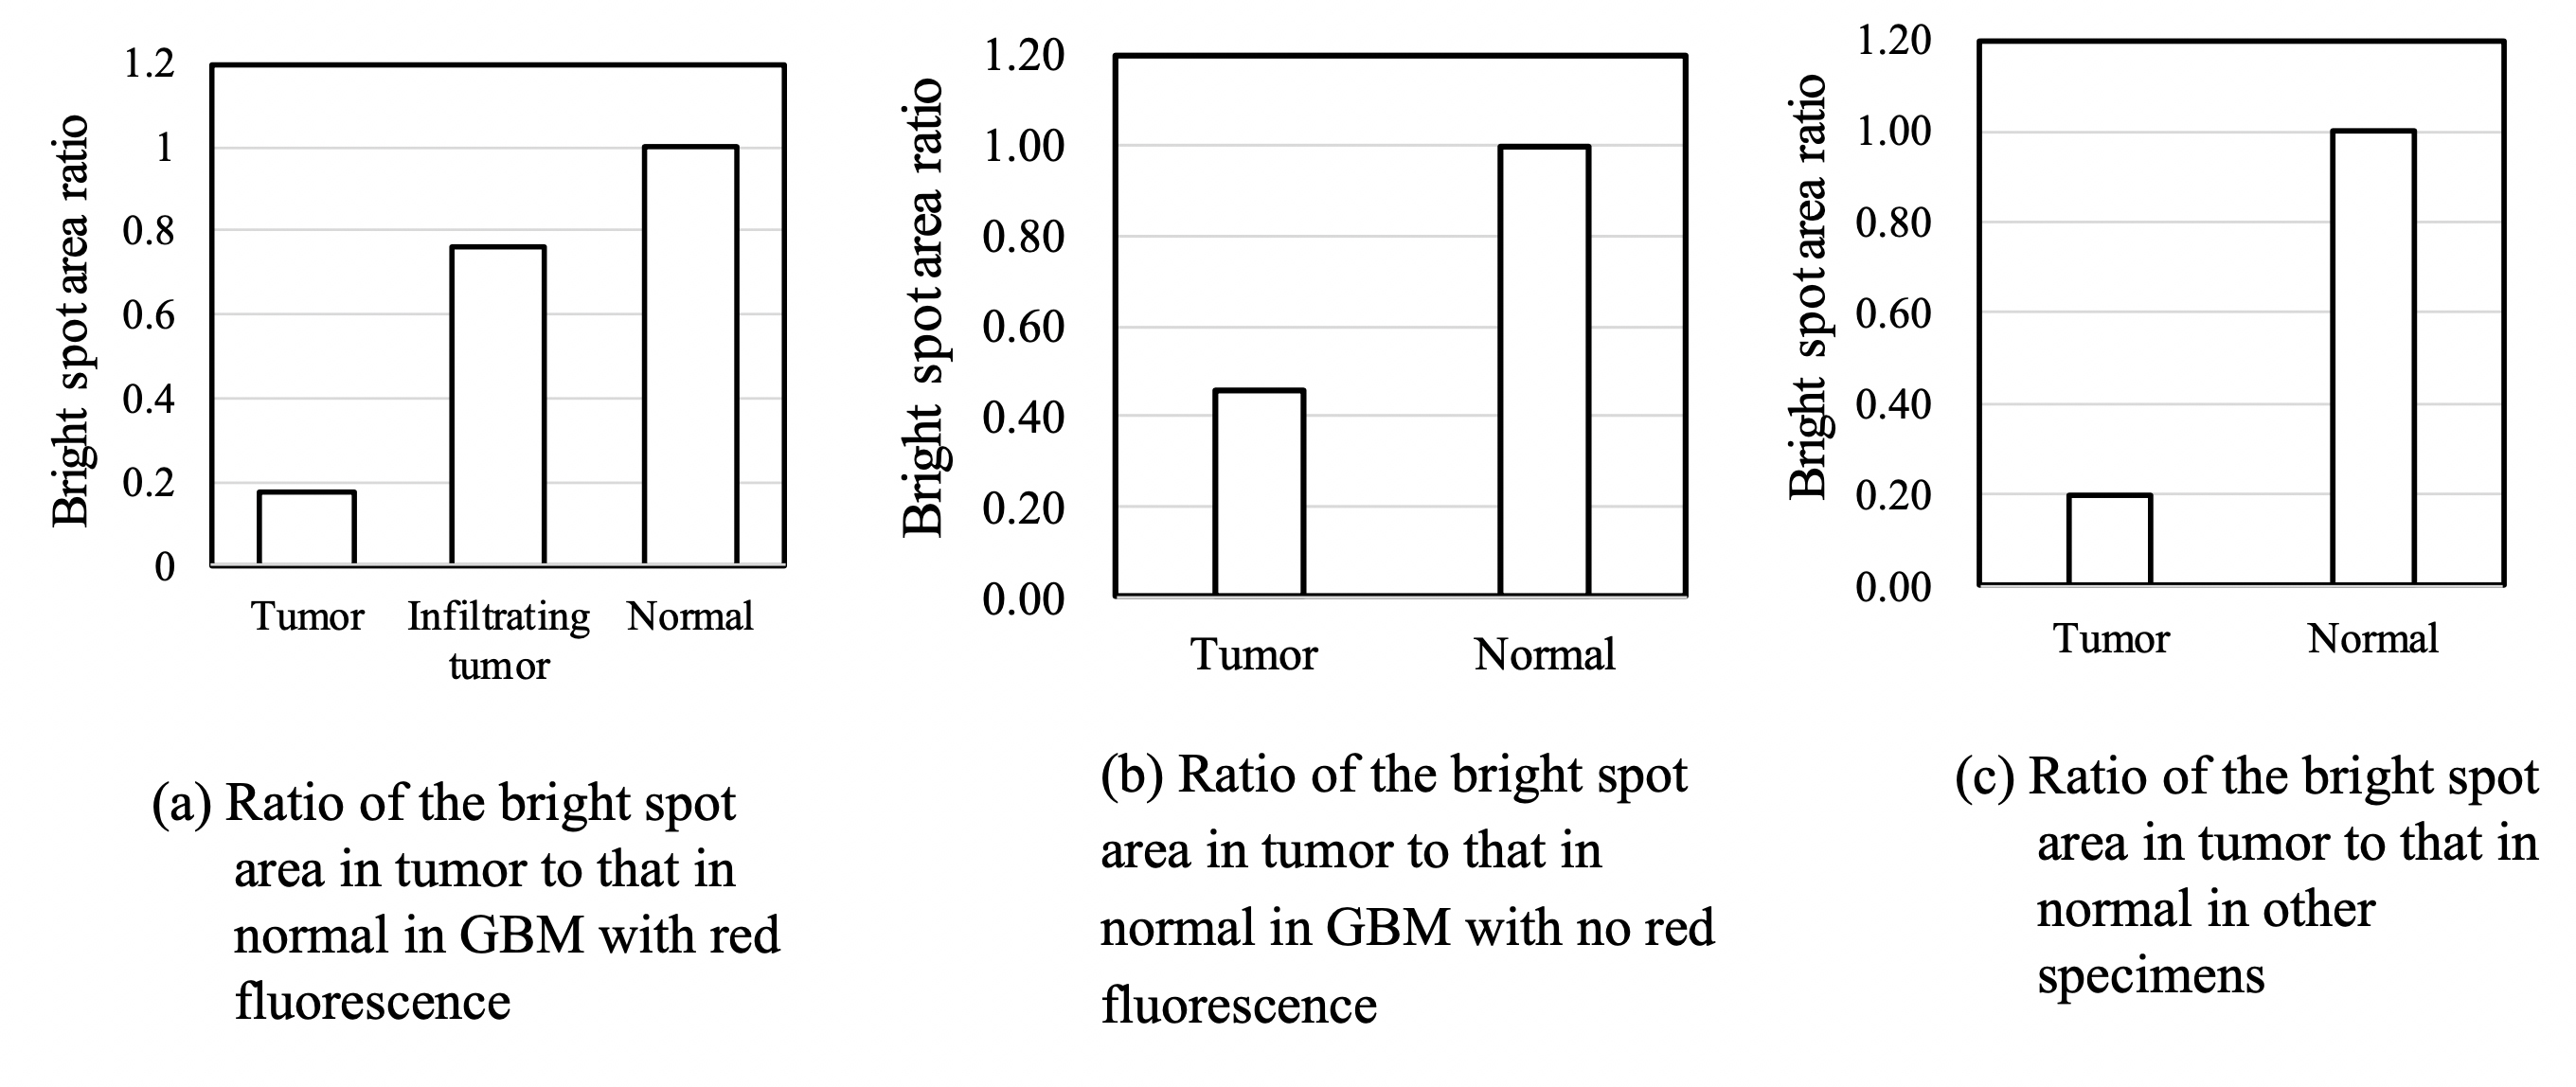
Figure 2.
Ratio of the average bright spot area in tumors to that in normal tissues for GBM specimens with or without 5-ALA fluorescence and other specimens. The ratio of the average bright spot area of a tumor or infiltrating tumor to that of the normal tissue region in GBM and other specimens is shown. In each case, the bright spot area was smaller in the tumor region than in the normal tissue region.
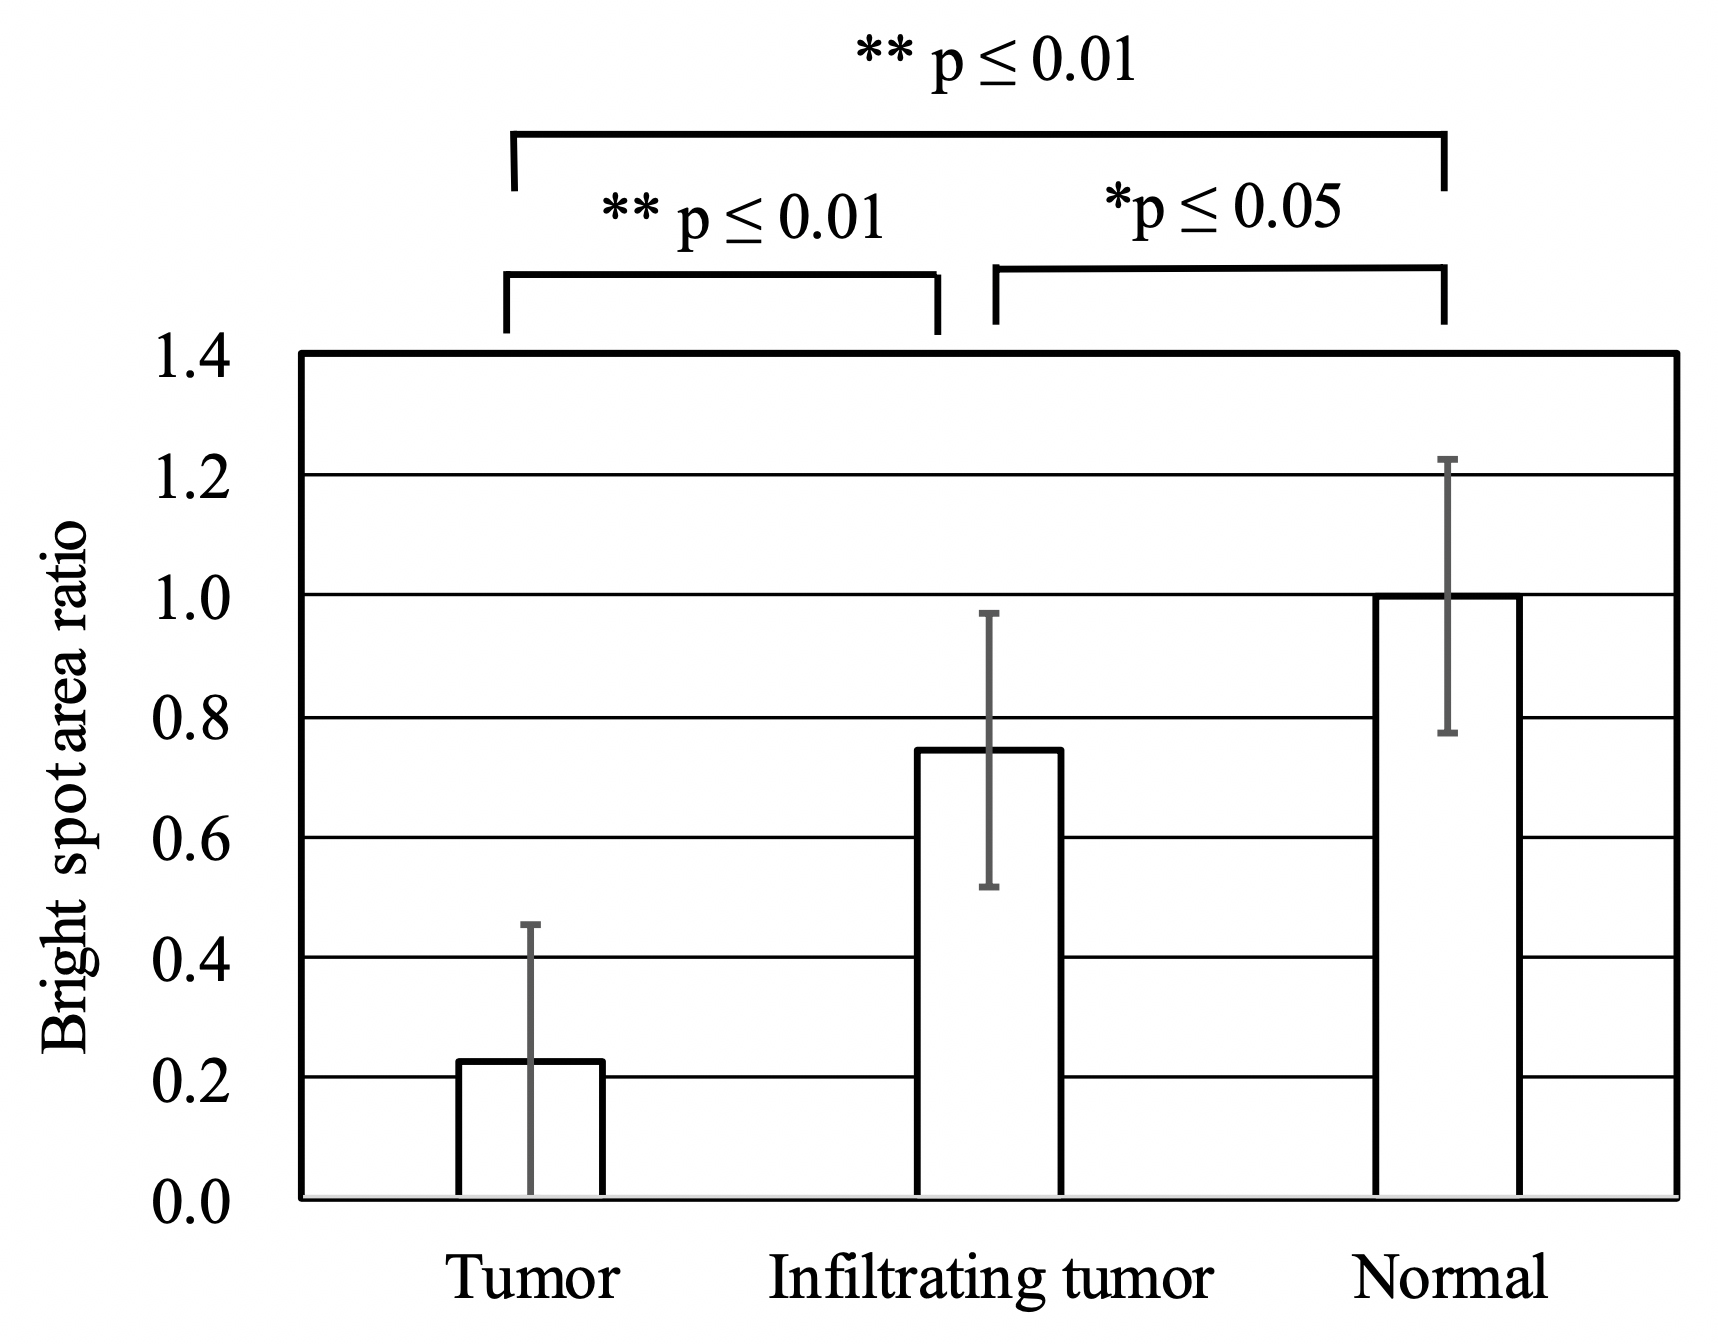
Figure 3.
Comparison of the bright spot areas in all specimens. The ratios of bright spot areas of 21 tumor samples and 12 infiltrating tumor samples to the averages of normal tissues are plotted as columns and error bars are standard deviations. Significant differences in averages determined by t-tests revealed a p-value of less than 0.05 between normal and infiltrating tumors and p-value of less than 0.01 between tumor and normal tissue, and tumors and infiltrating tumors. These results indicated that bright spot analysis could discriminate various kinds of tumors.
Article
Bright spot analysis for photodynamic diagnosis of brain tumors using confocal microscopy
Journal: Photodiagnosis and Photodynamic Therapy
Authors: Takeshi Yoneyama, Tetsuyo Watanabe, Sho Tamai, Katsuyoshi Miyashita, Mitsutoshi Nakada
DOI: 10.1016/j.pdpdt.2019.02.005
Funder
Japan Society for the Promotion of Science KAKENHI Grant Number 26242054